Restaurant POS Uptime Data: What to Track Before You Upgrade
Time
Click Count
Restaurant POS Uptime Data: What to Track Before You Upgrade
Before investing in a new system, technical teams need clear restaurant POS uptime data, not polished sales language.
The real question is simple: can the platform stay stable when service pressure is highest?
That answer rarely comes from a vendor demo.
It comes from measured restaurant POS uptime data across stores, shifts, devices, and integrations.
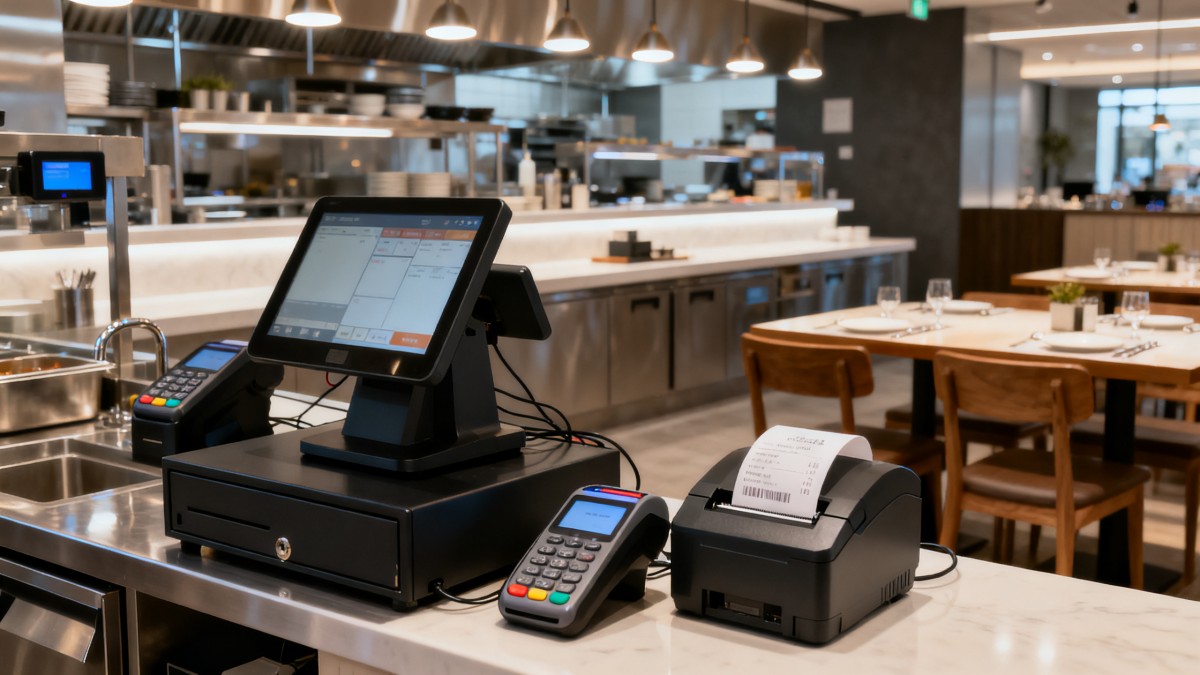
In practice, upgrade decisions fail when evaluators focus only on features, interface design, or price.
More meaningful signals come from outage patterns, restart behavior, latency, and recovery discipline.
This also matters for broader commercial benchmarking.
Platforms like G-BCE increasingly frame POS evaluation as an infrastructure reliability issue, not a software shopping exercise.
When restaurant POS uptime data is structured well, it turns an upgrade into a risk-control decision with measurable business impact.
Why Restaurant POS Uptime Data Matters More Than Feature Lists
Most POS failures do not look dramatic at first.
A terminal freezes for two minutes. A kitchen ticket prints late. A payment retry takes too long.
Each event seems minor, yet repeated friction damages throughput and customer trust.
That is why restaurant POS uptime data should include both total availability and degraded performance periods.
A vendor may claim 99.9% uptime.
Still, that number means little without context.
Was uptime measured at the cloud service layer, store gateway layer, or terminal session layer?
Did the system remain usable during network degradation, or merely remain technically online?
Availability alone is too narrow
Useful restaurant POS uptime data should describe continuity, not only status.
A system can be available but still create failed orders, delayed sync, and payment bottlenecks.
That broader view is what separates operational reliability from a marketing SLA.
The Core Metrics to Track Before a POS Upgrade
From recent upgrade programs, the most useful restaurant POS uptime data usually fits into a focused scorecard.
The goal is not more data.
The goal is decision-grade data.
- Uptime percentage by store, device type, and service window.
- Outage frequency, including partial outages and integration failures.
- Mean time to detect issues and mean time to recover.
- Transaction latency during lunch, dinner, and promotional peaks.
- Offline mode performance and sync integrity after reconnection.
- Payment authorization success rate under load.
- Print, kitchen routing, and order acknowledgment delay.
- Reboot frequency, patch stability, and post-update failure rate.
Each metric should be logged with timestamp, location, trigger condition, and business effect.
Without that structure, restaurant POS uptime data becomes hard to compare across vendors or pilot sites.
A practical benchmark table
Where Restaurant POS Uptime Data Usually Gets Distorted
One common problem is selective measurement.
Restaurant POS uptime data often excludes third-party dependencies such as payment gateways, kitchen display services, or menu sync tools.
Yet stores experience all of those failures as one POS problem.
Another issue is averaging across quiet periods.
If the platform performs well at 3 p.m. but slows at 12:15 p.m., the average hides the real exposure.
In actual operations, peak-hour reliability is the standard that matters most.
Watch for these reporting gaps
- No separation between cloud uptime and store-level usability.
- No logging of short disruptions under five minutes.
- No visibility into failed retries or duplicate transactions.
- No comparison between wired and wireless device performance.
- No clear record of firmware, patch, or driver-related incidents.
If these gaps remain, restaurant POS uptime data will look cleaner than operations actually are.
How to Collect Upgrade-Ready Restaurant POS Uptime Data
Good collection starts before the pilot begins.
First, define the operating states you care about.
That usually includes normal service, degraded service, offline mode, and total outage.
Then map every touchpoint that can break the order flow.
Think terminals, tablets, printers, payment devices, routers, kitchen displays, and API connections.
- Set a baseline using the current platform across at least four weeks.
- Capture restaurant POS uptime data during known traffic peaks and promotional events.
- Use the same incident definitions for the legacy and candidate systems.
- Tag every issue by root cause, workaround, and business interruption length.
- Review results by store format, because drive-thru, dine-in, and quick-service patterns differ.
This approach makes restaurant POS uptime data useful for comparison instead of post-project storytelling.
It also helps procurement, operations, and IT speak from the same evidence base.
How to Interpret the Data Against Risk and Standards
Raw numbers are only the start.
The next step is to judge whether the platform is operationally resilient and technically mature.
That is where broader benchmarking becomes useful.
G-BCE and similar frameworks connect hardware quality, integration discipline, and standards alignment into one evaluation lens.
For restaurant POS uptime data, interpretation should include technical architecture and equipment compliance.
A platform built on unstable peripherals or weak certification practices creates hidden reliability debt.
Relevant references may include UL, CE, and other deployment-specific electrical or product standards.
Questions that sharpen the evaluation
- Does performance remain stable when multiple integrations fail at once?
- Can the store continue trading during WAN disruption?
- Are recovery procedures automated or dependent on manual staff intervention?
- Do pilot results reflect the final hardware stack and network topology?
Turning Restaurant POS Uptime Data Into an Upgrade Decision
At decision time, the strongest case is usually not the lowest incident count alone.
It is the system with predictable behavior, fast recovery, and acceptable performance during pressure.
That is the value of disciplined restaurant POS uptime data.
It exposes where a vendor is robust, where architecture is fragile, and where rollout risk is being underestimated.
A strong upgrade brief should end with a clear decision matrix.
Include baseline metrics, pilot findings, peak-hour results, failure modes, and recovery performance.
Then connect each point to revenue protection, labor continuity, and guest experience.
That keeps the discussion grounded in operational value instead of feature excitement.
In the end, restaurant POS uptime data is not just a reporting layer.
It is the evidence base for choosing a platform that can support service continuity and future scale.
Before approving the upgrade, make sure the data proves the system can hold up when the restaurant is busiest.
News Recommendations
 What records are needed for an ISO 9001 furniture factory audit?
![51a6ab95581761cc26f4318be6520c15]()
Aris Katos
Future of Carbide Coatings
 How to choose AI marketing tools that work with your existing CRM
![51a6ab95581761cc26f4318be6520c15]()
Aris Katos
Future of Carbide Coatings
 Do freight costs erase savings when buying retail fixtures wholesale?
![51a6ab95581761cc26f4318be6520c15]()
Aris Katos
Future of Carbide Coatings
 What brightness should an OEM shelf LCD screen have for retail use?
![51a6ab95581761cc26f4318be6520c15]()
Aris Katos
Future of Carbide Coatings
 Can smart retail IT solutions for CPG work with legacy POS systems?
![51a6ab95581761cc26f4318be6520c15]()
Aris Katos
Future of Carbide Coatings
 What permit approvals belong in a commercial fitout planning checklist?
![51a6ab95581761cc26f4318be6520c15]()
Aris Katos
Future of Carbide Coatings
 Does Data Transparency Matter When Selecting Consumer Goods Suppliers?
![51a6ab95581761cc26f4318be6520c15]()
Aris Katos
Future of Carbide Coatings
 How Does Commercial Design Differ from Interior Decoration?
![51a6ab95581761cc26f4318be6520c15]()
Aris Katos
Future of Carbide Coatings
 How Long Does It Take to Verify a Commercial Furniture Supplier?
![51a6ab95581761cc26f4318be6520c15]()
Aris Katos
Future of Carbide Coatings
 How to verify compostability claims from a bubble mailer manufacturer
![51a6ab95581761cc26f4318be6520c15]()
Aris Katos
Future of Carbide Coatings
 Will commercial smart infrastructure solutions work with legacy systems?
![51a6ab95581761cc26f4318be6520c15]()
Aris Katos
Future of Carbide Coatings
 How to verify a preschool furniture manufacturer's safety standards
![51a6ab95581761cc26f4318be6520c15]()
Aris Katos
Future of Carbide Coatings
 A technical comparison of semiconductor processes for power devices
![51a6ab95581761cc26f4318be6520c15]()
Aris Katos
Future of Carbide Coatings
 How to verify that a BIFMA ergonomic chair meets the standard
![51a6ab95581761cc26f4318be6520c15]()
Aris Katos
Future of Carbide Coatings
 How to use a CRI value chart when choosing LED lighting
![51a6ab95581761cc26f4318be6520c15]()
Aris Katos
Future of Carbide Coatings
 How to compare hotel aroma diffuser wholesale options by coverage area
![51a6ab95581761cc26f4318be6520c15]()
Aris Katos
Future of Carbide Coatings
 How to prevent O-rings and seals from failing in food equipment
![51a6ab95581761cc26f4318be6520c15]()
Aris Katos
Future of Carbide Coatings
 How to compare commercial linear light wholesale quotes accurately
![51a6ab95581761cc26f4318be6520c15]()
Aris Katos
Future of Carbide Coatings
 How to verify international standards compliance for Middle East exports
![51a6ab95581761cc26f4318be6520c15]()
Aris Katos
Future of Carbide Coatings
 How to select laboratory instruments for reproducible test results
![51a6ab95581761cc26f4318be6520c15]()
Aris Katos
Future of Carbide Coatings
 When does a sheet metal prototype reveal design flaws early?
![51a6ab95581761cc26f4318be6520c15]()
Aris Katos
Future of Carbide Coatings
 When PE air column bags reduce damage in e-commerce fulfillment
![51a6ab95581761cc26f4318be6520c15]()
Aris Katos
Future of Carbide Coatings
 How energy-efficient design reduces operating costs in retail lighting
![51a6ab95581761cc26f4318be6520c15]()
Aris Katos
Future of Carbide Coatings
 When commercial aluminum storefronts make sense for a retail renovation
![51a6ab95581761cc26f4318be6520c15]()
Aris Katos
Future of Carbide Coatings
 What makes LED lights durable in high-use commercial spaces?
![51a6ab95581761cc26f4318be6520c15]()
Aris Katos
Future of Carbide Coatings
 Which industry categories offer the strongest export potential in Latin America?
![51a6ab95581761cc26f4318be6520c15]()
Aris Katos
Future of Carbide Coatings
 How to choose an ultra bright waterproof window display for storefronts
![51a6ab95581761cc26f4318be6520c15]()
Aris Katos
Future of Carbide Coatings
 How to verify suppliers on a trade portal for global sourcing
![51a6ab95581761cc26f4318be6520c15]()
Aris Katos
Future of Carbide Coatings
 How RoHS requirements should be stated in product specifications
![51a6ab95581761cc26f4318be6520c15]()
Aris Katos
Future of Carbide Coatings
 What affects the lead time for custom retail counter displays?
![51a6ab95581761cc26f4318be6520c15]()
Aris Katos
Future of Carbide Coatings
 What consumer packaging USA importers need to verify before ordering
![51a6ab95581761cc26f4318be6520c15]()
Aris Katos
Future of Carbide Coatings
 How commercial spaces interiors shape customer dwell time
![51a6ab95581761cc26f4318be6520c15]()
Aris Katos
Future of Carbide Coatings
 How LED commercial lighting design reduces glare in retail spaces
![51a6ab95581761cc26f4318be6520c15]()
Aris Katos
Future of Carbide Coatings
 How industrial technology information improves RFID inventory accuracy
![51a6ab95581761cc26f4318be6520c15]()
Aris Katos
Future of Carbide Coatings
 When drip garden watering systems make more sense than sprinklers
![51a6ab95581761cc26f4318be6520c15]()
Aris Katos
Future of Carbide Coatings
 When category comparison improves sourcing for industrial applications
![51a6ab95581761cc26f4318be6520c15]()
Aris Katos
Future of Carbide Coatings
 Industrial application guidance for selecting the right LED lighting
![51a6ab95581761cc26f4318be6520c15]()
Aris Katos
Future of Carbide Coatings
 Which commercial architecture standards apply to European retail fit-outs?
![51a6ab95581761cc26f4318be6520c15]()
Aris Katos
Future of Carbide Coatings
 How to verify FDA requirements for maternity care products
![51a6ab95581761cc26f4318be6520c15]()
Aris Katos
Future of Carbide Coatings