Retail Benchmarking for Stores: Which Metrics Actually Matter
Time
Click Count
Why Retail Benchmarking Has Become More Complex
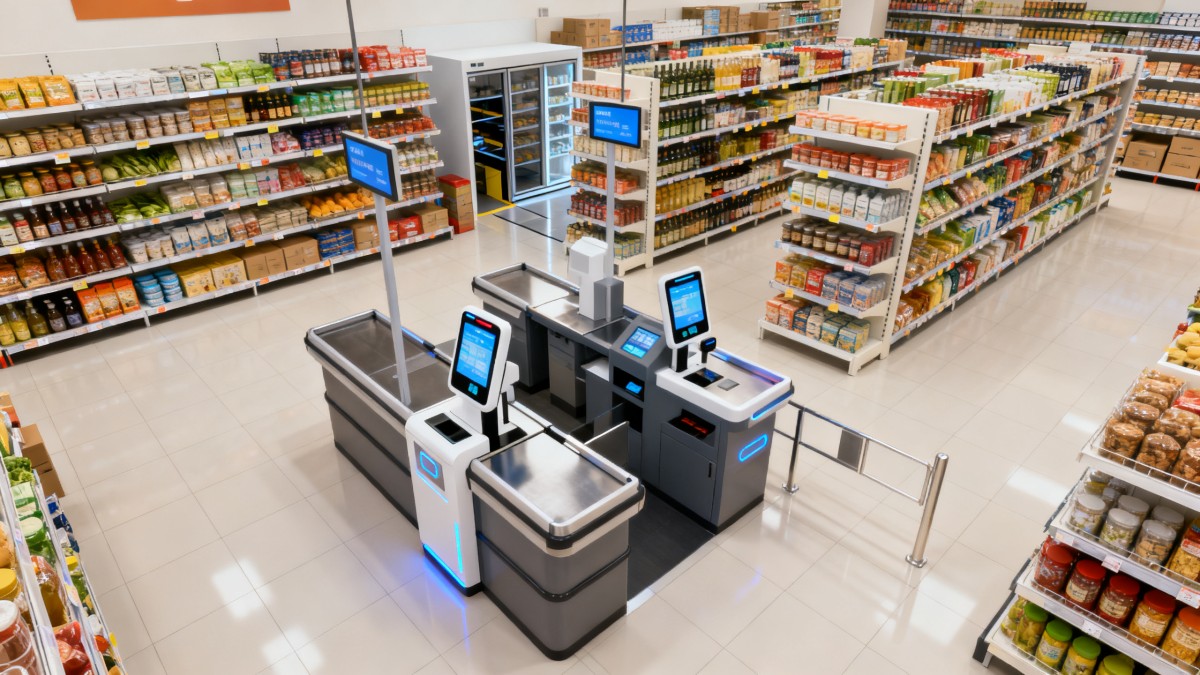
Retail benchmarking for stores now reaches far beyond weekly revenue and same-store sales.
Store performance is shaped by layout quality, digital tools, replenishment speed, labor use, and customer friction.
That shift matters because physical retail is no longer judged only by transactions.
It is judged by resilience, consistency, and how well each store supports the wider commercial ecosystem.
In that context, retail benchmarking for stores becomes a decision framework rather than a reporting exercise.
A useful benchmark compares operational reality across locations, formats, and supplier networks.
It also helps separate temporary wins from structural strength.
This is especially relevant in environments where fixtures, smart retail technology, packaging, signage, and sourcing standards influence results together.
That broader view is why platforms such as G-BCE matter.
Cross-sector benchmarking gives commercial teams a more complete way to evaluate store conditions, hardware choices, and supply chain readiness.
What Retail Benchmarking for Stores Should Really Measure
The strongest benchmarks connect financial output with operational causes.
Looking only at top-line sales can hide weak traffic quality, poor conversion, or unstable fulfillment.
A practical model usually groups metrics into four layers.
Commercial performance
These are still essential, but they need context.
- Sales per square foot or square meter
- Gross margin return on inventory investment
- Average transaction value
- Category contribution by store zone
- Markdown dependency
These indicators show whether a store is productive, but not why it performs that way.
Customer movement and experience
Retail benchmarking for stores should measure how visitors become buyers.
- Footfall by hour and entrance
- Conversion rate
- Dwell time in priority zones
- Queue time at checkout or service points
- Return visits and loyalty participation
These metrics reveal whether store design, wayfinding, staffing, and technology support a smooth journey.
Operational reliability
A profitable store can still be structurally weak.
- On-shelf availability
- Inventory accuracy
- Replenishment cycle time
- Order fulfillment accuracy
- Downtime of POS, kiosks, or smart devices
In practice, these are often the metrics that explain uneven store results across regions.
Physical and technical infrastructure
This layer is often under-measured, even though it affects every store outcome.
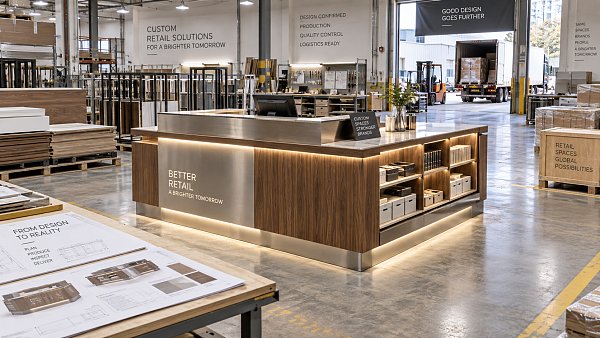
Fixtures, lighting, signage, ergonomic workstations, and device performance shape selling conditions every day.
Benchmarking against standards such as UL, CE, and BIFMA adds comparability where visual impressions alone are misleading.
Which Metrics Matter Most in Current Market Conditions
Not every metric deserves equal weight.
Current retail conditions reward stores that can adapt quickly without losing consistency.
That makes a few measures especially important.
These measures work because they connect visible store outcomes with repeatable operating conditions.
They are also harder to manipulate through short-term discounting or reporting timing.
Benchmarking Across Store Formats and Supply Networks
Retail benchmarking for stores becomes more useful when comparisons are fair.
A flagship in a dense city should not be measured exactly like a suburban showroom or a hybrid pickup location.
The same applies to stores with different assortments, climate demands, labor models, or digital penetration.
A better method is to benchmark within comparable clusters.
- By store format and selling area
- By traffic profile and location type
- By category mix and price architecture
- By technology stack and service model
- By supplier dependency and replenishment distance
This is where a broader intelligence base adds real value.
G-BCE’s cross-sector perspective is useful because store outcomes are rarely isolated from upstream design and sourcing decisions.
Commercial fixtures influence product presentation and labor ergonomics.
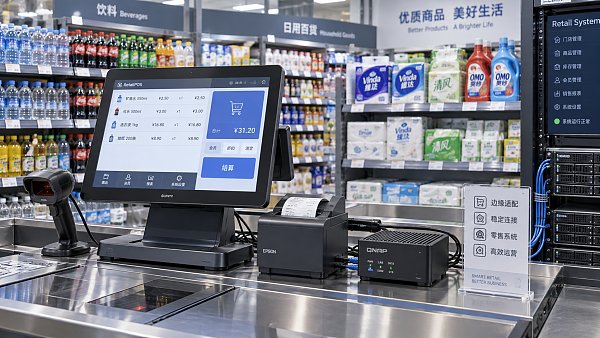
Smart retail devices affect transaction speed and data visibility.
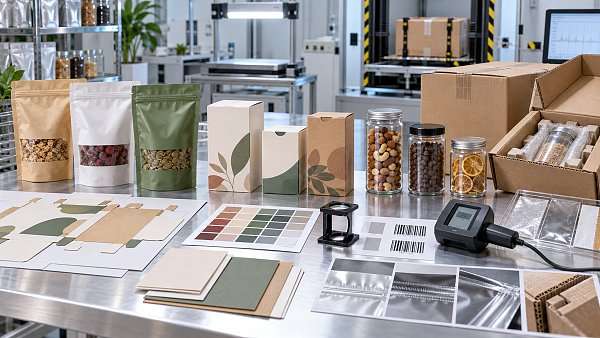
Packaging and signage affect handling efficiency, compliance, and customer perception.
When these factors are benchmarked together, store performance becomes easier to explain and improve.
How to Use Benchmarks Without Distorting Decisions
Good benchmarking is selective.
Too many metrics create noise, and isolated metrics create false confidence.
Three habits usually keep retail benchmarking for stores grounded in business reality.
Pair outcome metrics with cause metrics
If conversion falls, review queue time, stock availability, traffic quality, and device uptime together.
That combination is more useful than treating sales decline as a standalone problem.
Normalize for local variables
Regional rent, store age, labor regulation, and climate can alter results significantly.
Benchmarks should adjust for what a location can realistically control.
Test infrastructure assumptions
A store may underperform because of layout bottlenecks, weak lighting, poor fixture durability, or aging POS hardware.
These are not cosmetic issues.
They shape capacity, safety, service speed, and maintenance cost over time.
A Practical Starting Point for Better Store Comparison
A workable benchmarking program does not need dozens of dashboards on day one.
It needs a stable baseline and a clear reason for each metric included.
Start with a short set of measures covering sales productivity, customer flow, inventory accuracy, fulfillment reliability, and technology uptime.
Then review whether physical infrastructure and supplier inputs are helping or limiting those outcomes.
Retail benchmarking for stores is most valuable when it links store-floor evidence with sourcing standards and operational design.
That is the point where comparisons stop being descriptive and start guiding action.
The next step is usually straightforward: define comparable store clusters, choose a focused metric set, and test each result against the underlying commercial environment.
From there, decisions about layout upgrades, smart retail technology, fixture standards, and supply chain adjustments become easier to justify.
News Recommendations
 What records are needed for an ISO 9001 furniture factory audit?
![51a6ab95581761cc26f4318be6520c15]()
Aris Katos
Future of Carbide Coatings
 How to choose AI marketing tools that work with your existing CRM
![51a6ab95581761cc26f4318be6520c15]()
Aris Katos
Future of Carbide Coatings
 Do freight costs erase savings when buying retail fixtures wholesale?
![51a6ab95581761cc26f4318be6520c15]()
Aris Katos
Future of Carbide Coatings
 Can smart retail IT solutions for CPG work with legacy POS systems?
![51a6ab95581761cc26f4318be6520c15]()
Aris Katos
Future of Carbide Coatings
 What permit approvals belong in a commercial fitout planning checklist?
![51a6ab95581761cc26f4318be6520c15]()
Aris Katos
Future of Carbide Coatings
 How Does Commercial Design Differ from Interior Decoration?
![51a6ab95581761cc26f4318be6520c15]()
Aris Katos
Future of Carbide Coatings
 How Long Does It Take to Verify a Commercial Furniture Supplier?
![51a6ab95581761cc26f4318be6520c15]()
Aris Katos
Future of Carbide Coatings
 How to verify compostability claims from a bubble mailer manufacturer
![51a6ab95581761cc26f4318be6520c15]()
Aris Katos
Future of Carbide Coatings
 Will commercial smart infrastructure solutions work with legacy systems?
![51a6ab95581761cc26f4318be6520c15]()
Aris Katos
Future of Carbide Coatings
 How to verify a preschool furniture manufacturer's safety standards
![51a6ab95581761cc26f4318be6520c15]()
Aris Katos
Future of Carbide Coatings
 A technical comparison of semiconductor processes for power devices
![51a6ab95581761cc26f4318be6520c15]()
Aris Katos
Future of Carbide Coatings
 How to verify that a BIFMA ergonomic chair meets the standard
![51a6ab95581761cc26f4318be6520c15]()
Aris Katos
Future of Carbide Coatings
 How to use a CRI value chart when choosing LED lighting
![51a6ab95581761cc26f4318be6520c15]()
Aris Katos
Future of Carbide Coatings
 How to compare hotel aroma diffuser wholesale options by coverage area
![51a6ab95581761cc26f4318be6520c15]()
Aris Katos
Future of Carbide Coatings
 How to prevent O-rings and seals from failing in food equipment
![51a6ab95581761cc26f4318be6520c15]()
Aris Katos
Future of Carbide Coatings
 How to compare commercial linear light wholesale quotes accurately
![51a6ab95581761cc26f4318be6520c15]()
Aris Katos
Future of Carbide Coatings
 How to verify international standards compliance for Middle East exports
![51a6ab95581761cc26f4318be6520c15]()
Aris Katos
Future of Carbide Coatings
 How to select laboratory instruments for reproducible test results
![51a6ab95581761cc26f4318be6520c15]()
Aris Katos
Future of Carbide Coatings
 When does a sheet metal prototype reveal design flaws early?
![51a6ab95581761cc26f4318be6520c15]()
Aris Katos
Future of Carbide Coatings
 When PE air column bags reduce damage in e-commerce fulfillment
![51a6ab95581761cc26f4318be6520c15]()
Aris Katos
Future of Carbide Coatings
 How energy-efficient design reduces operating costs in retail lighting
![51a6ab95581761cc26f4318be6520c15]()
Aris Katos
Future of Carbide Coatings
 When commercial aluminum storefronts make sense for a retail renovation
![51a6ab95581761cc26f4318be6520c15]()
Aris Katos
Future of Carbide Coatings
 What makes LED lights durable in high-use commercial spaces?
![51a6ab95581761cc26f4318be6520c15]()
Aris Katos
Future of Carbide Coatings
 Which industry categories offer the strongest export potential in Latin America?
![51a6ab95581761cc26f4318be6520c15]()
Aris Katos
Future of Carbide Coatings
 How to choose an ultra bright waterproof window display for storefronts
![51a6ab95581761cc26f4318be6520c15]()
Aris Katos
Future of Carbide Coatings
 How to verify suppliers on a trade portal for global sourcing
![51a6ab95581761cc26f4318be6520c15]()
Aris Katos
Future of Carbide Coatings
 How RoHS requirements should be stated in product specifications
![51a6ab95581761cc26f4318be6520c15]()
Aris Katos
Future of Carbide Coatings
 What affects the lead time for custom retail counter displays?
![51a6ab95581761cc26f4318be6520c15]()
Aris Katos
Future of Carbide Coatings
 What consumer packaging USA importers need to verify before ordering
![51a6ab95581761cc26f4318be6520c15]()
Aris Katos
Future of Carbide Coatings
 How commercial spaces interiors shape customer dwell time
![51a6ab95581761cc26f4318be6520c15]()
Aris Katos
Future of Carbide Coatings
 How LED commercial lighting design reduces glare in retail spaces
![51a6ab95581761cc26f4318be6520c15]()
Aris Katos
Future of Carbide Coatings
 How industrial technology information improves RFID inventory accuracy
![51a6ab95581761cc26f4318be6520c15]()
Aris Katos
Future of Carbide Coatings
 When drip garden watering systems make more sense than sprinklers
![51a6ab95581761cc26f4318be6520c15]()
Aris Katos
Future of Carbide Coatings
 When category comparison improves sourcing for industrial applications
![51a6ab95581761cc26f4318be6520c15]()
Aris Katos
Future of Carbide Coatings
 Industrial application guidance for selecting the right LED lighting
![51a6ab95581761cc26f4318be6520c15]()
Aris Katos
Future of Carbide Coatings
 Which commercial architecture standards apply to European retail fit-outs?
![51a6ab95581761cc26f4318be6520c15]()
Aris Katos
Future of Carbide Coatings
 How to verify FDA requirements for maternity care products
![51a6ab95581761cc26f4318be6520c15]()
Aris Katos
Future of Carbide Coatings
 How to verify BPA-free claims for food-contact products
![51a6ab95581761cc26f4318be6520c15]()
Aris Katos
Future of Carbide Coatings
 When does a European wholesale supplier suit modular office projects?
![51a6ab95581761cc26f4318be6520c15]()
Aris Katos
Future of Carbide Coatings