Retail Benchmarking Analysis: Which Metrics Actually Drive Margin
Time
Click Count
Retail margin is being shaped by far more than ticket size or markdown depth. A useful retail benchmarking analysis connects merchandising, store operations, supply chain design, and physical environment quality to profit outcomes that can actually be managed.
That shift matters because many retailers still compare broad averages while missing the metrics that explain margin leakage. The stronger approach is to benchmark the few indicators that reveal how inventory, technology, fixtures, labor, and customer flow perform together.
This is where cross-sector visibility becomes practical. Platforms such as G-BCE help frame retail performance through commercial furniture, smart retail technology, supply chain infrastructure, lighting, signage, and sustainable packaging rather than through sales data alone.
What retail benchmarking analysis should really measure

At its best, retail benchmarking analysis compares performance against a relevant peer set and then traces margin impact back to operating conditions. It is not a scoreboard. It is a decision tool.
The most valuable benchmarks are usually directional, not decorative. They show where profitability improves, where friction is expensive, and where investment is justified.
A chain with strong topline growth can still underperform on margin if stock turns are weak, fixtures reduce selling density, or returns handling absorbs labor. Benchmarks should expose those hidden cost structures.
Margin drivers are often interconnected
Gross margin rate matters, but it rarely tells the whole story. A higher margin mix can be offset by shrink, poor replenishment timing, low conversion, inefficient displays, or costly last-mile packaging.
That is why retail benchmarking analysis should be built around operating relationships. One metric alone may look acceptable. The combined pattern often reveals the true source of profit pressure.
The metrics that tend to move margin most
Not every KPI deserves executive attention. The following metrics usually have the clearest connection to sustainable margin performance across store-based, omnichannel, and mixed retail models.
These metrics become more powerful when segmented by category, format, region, and store maturity. Benchmarking enterprise averages alone can hide where margin is being won or lost.
Two overlooked indicators
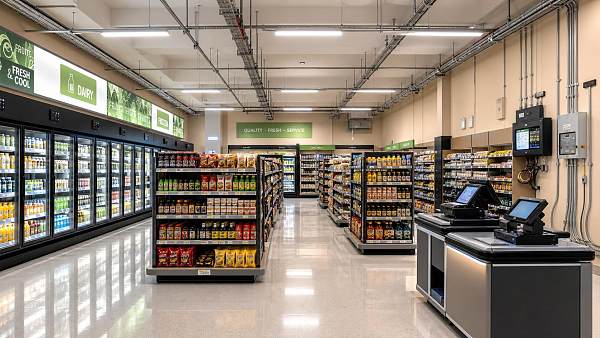
Fixture productivity is often ignored. Display systems, shelving geometry, checkout placement, and signage quality directly affect browsing time, visibility, replenishment labor, and basket composition.
Packaging cost-to-protection ratio is another. In omnichannel retail, poor packaging design increases damage, returns, waste handling, and freight inefficiency, all of which reduce net margin.
Why the physical environment still matters
Retail benchmarking analysis is often framed as a data exercise, yet many margin outcomes begin in the built environment. Store hardware influences both customer behavior and operating cost.
Lighting affects product perception and dwell time. Signage affects wayfinding and promotion clarity. Ergonomic fixtures affect labor efficiency. POS hardware affects queue speed and transaction recovery.
G-BCE’s perspective is useful here because it connects commercial components to measurable business performance. Benchmarking a shelf system, AI-enabled POS terminal, or compliant packaging format against standards such as UL, CE, and BIFMA is not merely technical. It reduces operating uncertainty.
That matters for chains expanding across regions. Margin can weaken when a store concept looks consistent on paper but performs differently because local materials, fixture durability, traffic flow, or compliance quality vary.
Where benchmarking becomes practical in day-to-day operations
The strongest retail benchmarking analysis usually shows up in routine decisions rather than annual reports. It helps refine assortment depth, reorder logic, store refresh priorities, and capital allocation.
- In merchandising, it clarifies whether low margin is a pricing problem or a stock quality problem.
- In store design, it tests whether layouts increase conversion or simply add visual complexity.
- In sourcing, it compares nominal unit savings against lifecycle cost, durability, and compliance risk.
- In omnichannel fulfillment, it reveals where packaging, picking time, and return rates consume margin silently.
- In technology investment, it separates useful automation from systems that create data without operational gains.
A common pattern is that margin improvement comes from removing friction between functions. Better inventory visibility fails if shelves are hard to replenish. Faster checkout underdelivers if queue design remains poor.
How to interpret benchmarks without being misled
Benchmarking becomes risky when comparisons ignore context. A premium specialty chain should not be judged by the same traffic and turn profile as a high-volume discount format.
Peer selection matters. So does the level of measurement. Category benchmarks, store cluster benchmarks, and regional supply chain benchmarks often reveal more than enterprise-wide ratios.
Useful filters for a serious retail benchmarking analysis
- Separate controllable metrics from external factors such as temporary commodity spikes.
- Compare planned margin with realized margin after returns, shrink, and fulfillment costs.
- Review trends over time instead of reacting to one reporting period.
- Link cost benchmarks to customer experience metrics, not cost alone.
- Test whether standards compliance supports durability and lower long-term replacement expense.
This is also where technical repositories add value. A margin discussion becomes sharper when commercial hardware, material choices, and supply chain formats are benchmarked with verified specifications instead of assumptions.
A better way to prioritize next actions
Not every weak benchmark deserves immediate intervention. The practical question is which metric has both high margin impact and a realistic path to improvement.
Start with a small set of linked measures. Gross margin return on inventory investment, markdown rate, return rate, sales density, and fixture or technology productivity often provide a strong initial map.
Then look one layer deeper. Ask whether underperformance is caused by assortment, demand sensing, display design, store hardware, packaging configuration, or cross-border sourcing variability.
That sequence keeps retail benchmarking analysis grounded in decisions that can be implemented, measured, and refined. It also avoids the trap of chasing benchmarks that look impressive but do little for margin quality.
A credible next step is to build a benchmark set around one category, one format, or one regional operating model. From there, compare the commercial environment, the supply chain assumptions, and the margin outcomes together before scaling any change.
News Recommendations
 How to use a CRI value chart when choosing LED lighting
![51a6ab95581761cc26f4318be6520c15]()
Aris Katos
Future of Carbide Coatings
 How to compare hotel aroma diffuser wholesale options by coverage area
![51a6ab95581761cc26f4318be6520c15]()
Aris Katos
Future of Carbide Coatings
 How to prevent O-rings and seals from failing in food equipment
![51a6ab95581761cc26f4318be6520c15]()
Aris Katos
Future of Carbide Coatings
 How to compare commercial linear light wholesale quotes accurately
![51a6ab95581761cc26f4318be6520c15]()
Aris Katos
Future of Carbide Coatings
 How to verify international standards compliance for Middle East exports
![51a6ab95581761cc26f4318be6520c15]()
Aris Katos
Future of Carbide Coatings
 How to select laboratory instruments for reproducible test results
![51a6ab95581761cc26f4318be6520c15]()
Aris Katos
Future of Carbide Coatings
 When does a sheet metal prototype reveal design flaws early?
![51a6ab95581761cc26f4318be6520c15]()
Aris Katos
Future of Carbide Coatings
 When PE air column bags reduce damage in e-commerce fulfillment
![51a6ab95581761cc26f4318be6520c15]()
Aris Katos
Future of Carbide Coatings
 How energy-efficient design reduces operating costs in retail lighting
![51a6ab95581761cc26f4318be6520c15]()
Aris Katos
Future of Carbide Coatings
 When commercial aluminum storefronts make sense for a retail renovation
![51a6ab95581761cc26f4318be6520c15]()
Aris Katos
Future of Carbide Coatings
 What makes LED lights durable in high-use commercial spaces?
![51a6ab95581761cc26f4318be6520c15]()
Aris Katos
Future of Carbide Coatings
 Which industry categories offer the strongest export potential in Latin America?
![51a6ab95581761cc26f4318be6520c15]()
Aris Katos
Future of Carbide Coatings
 How to choose an ultra bright waterproof window display for storefronts
![51a6ab95581761cc26f4318be6520c15]()
Aris Katos
Future of Carbide Coatings
 How to verify suppliers on a trade portal for global sourcing
![51a6ab95581761cc26f4318be6520c15]()
Aris Katos
Future of Carbide Coatings
 How RoHS requirements should be stated in product specifications
![51a6ab95581761cc26f4318be6520c15]()
Aris Katos
Future of Carbide Coatings
 What affects the lead time for custom retail counter displays?
![51a6ab95581761cc26f4318be6520c15]()
Aris Katos
Future of Carbide Coatings
 What consumer packaging USA importers need to verify before ordering
![51a6ab95581761cc26f4318be6520c15]()
Aris Katos
Future of Carbide Coatings
 How commercial spaces interiors shape customer dwell time
![51a6ab95581761cc26f4318be6520c15]()
Aris Katos
Future of Carbide Coatings
 How LED commercial lighting design reduces glare in retail spaces
![51a6ab95581761cc26f4318be6520c15]()
Aris Katos
Future of Carbide Coatings
 How industrial technology information improves RFID inventory accuracy
![51a6ab95581761cc26f4318be6520c15]()
Aris Katos
Future of Carbide Coatings
 When drip garden watering systems make more sense than sprinklers
![51a6ab95581761cc26f4318be6520c15]()
Aris Katos
Future of Carbide Coatings
 When category comparison improves sourcing for industrial applications
![51a6ab95581761cc26f4318be6520c15]()
Aris Katos
Future of Carbide Coatings
 Industrial application guidance for selecting the right LED lighting
![51a6ab95581761cc26f4318be6520c15]()
Aris Katos
Future of Carbide Coatings
 Which commercial architecture standards apply to European retail fit-outs?
![51a6ab95581761cc26f4318be6520c15]()
Aris Katos
Future of Carbide Coatings
 How to verify FDA requirements for maternity care products
![51a6ab95581761cc26f4318be6520c15]()
Aris Katos
Future of Carbide Coatings
 How to verify BPA-free claims for food-contact products
![51a6ab95581761cc26f4318be6520c15]()
Aris Katos
Future of Carbide Coatings
 When does a European wholesale supplier suit modular office projects?
![51a6ab95581761cc26f4318be6520c15]()
Aris Katos
Future of Carbide Coatings
 When consumer ecosystem solutions improve the in-store shopping journey
![51a6ab95581761cc26f4318be6520c15]()
Aris Katos
Future of Carbide Coatings
 How a commercial developers network can reduce site selection risk
![51a6ab95581761cc26f4318be6520c15]()
Aris Katos
Future of Carbide Coatings
 How clear purchasing specifications prevent costly supplier deviations
![51a6ab95581761cc26f4318be6520c15]()
Aris Katos
Future of Carbide Coatings
 What an ISTA drop test lab checks before your packaging ships
![51a6ab95581761cc26f4318be6520c15]()
Aris Katos
Future of Carbide Coatings
 Which commercial furniture standards apply to workplace seating?
![51a6ab95581761cc26f4318be6520c15]()
Aris Katos
Future of Carbide Coatings
 How to evaluate smart lighting module OEM compatibility before sampling
![51a6ab95581761cc26f4318be6520c15]()
Aris Katos
Future of Carbide Coatings
 How to assess whether sustainable technology delivers real impact
![51a6ab95581761cc26f4318be6520c15]()
Aris Katos
Future of Carbide Coatings
 How to assess an OEM supplier’s quality control before ordering
![51a6ab95581761cc26f4318be6520c15]()
Aris Katos
Future of Carbide Coatings
 How consumer ecosystem solutions data can improve retail personalization
![51a6ab95581761cc26f4318be6520c15]()
Aris Katos
Future of Carbide Coatings
 When does consumer packaging design justify a higher product price?
![51a6ab95581761cc26f4318be6520c15]()
Aris Katos
Future of Carbide Coatings
 Supermarket Fixture Installation: Planning Layouts, Wiring, and Handover
![51a6ab95581761cc26f4318be6520c15]()
Aris Katos
Future of Carbide Coatings
 Automated Lighting and Smart Lighting Control in Bergerac: Key Project Considerations
![51a6ab95581761cc26f4318be6520c15]()
Aris Katos
Future of Carbide Coatings