Commercial Optimization Guide: Costs, Risks, and ROI Benchmarks
Time
Click Count
Why does a commercial optimization guide matter before any upgrade starts?

A commercial optimization guide is useful because most modernization projects fail at the comparison stage, not the installation stage.
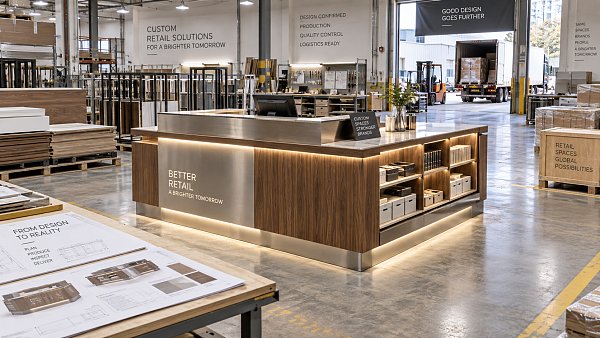
Retail fit-outs, smart POS systems, lighting retrofits, fixtures, and packaging changes often look comparable on paper. In practice, their cost structures behave very differently.
That is where a structured commercial optimization guide becomes practical. It helps connect capital spending with operating impact, compliance exposure, and measurable return windows.
For commercial spaces and consumer supply chains, optimization is rarely one purchase. It is usually a system decision across furniture, technology, lighting, signage, and material flow.
A more reliable evaluation method looks at three layers together: direct cost, operational friction, and brand experience.
G-BCE has value in this context because it frames those decisions with technical benchmarks and international standards, instead of isolated supplier claims.
That matters when one region prioritizes price speed, while another requires stronger alignment with UL, CE, BIFMA, sustainability targets, or premium visual standards.
The real question is not whether modernization is necessary. The better question is which investments improve commercial performance without creating hidden long-term drag.
What costs are usually underestimated in commercial optimization?
The obvious line items are equipment, fixtures, logistics, and installation. The underestimated costs sit around them.
In a typical commercial optimization guide, the biggest blind spots include integration labor, testing delays, maintenance training, packaging redesign, and downtime during rollout.
For example, an AI-enabled POS terminal may appear cost-effective. Yet software mapping, payment compliance, data migration, and staff retraining can change the payback math.
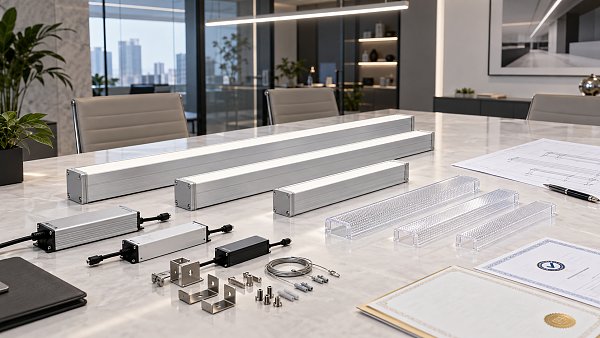
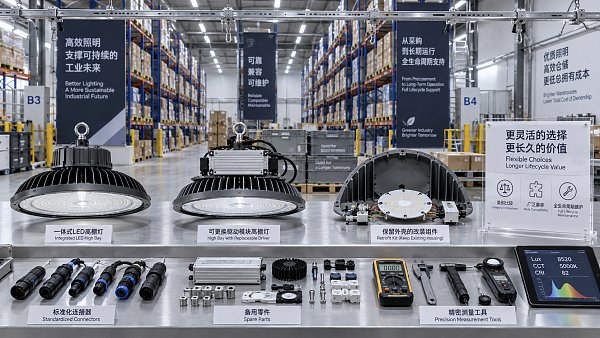
The same pattern applies to commercial lighting and signage. Hardware savings can be erased by rework if brightness, wiring loads, control compatibility, or local certification were not checked early.
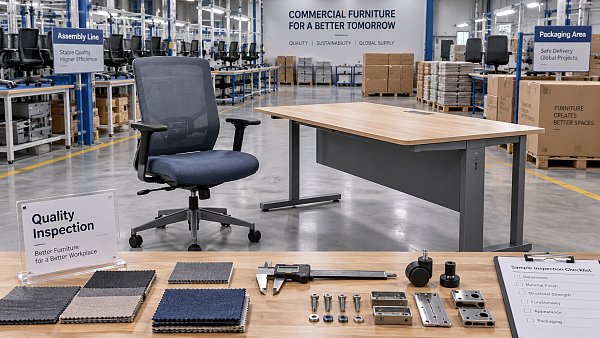
Furniture and fixtures create another common trap. A lower unit price may hide shorter lifespan, weaker ergonomic performance, or inconsistent tolerances across locations.
Sustainable packaging decisions can also be misread. Material cost is only one part. Damage rate, cube efficiency, print consistency, and disposal requirements also affect total landed cost.
A practical commercial optimization guide therefore compares cost in five buckets:
- Acquisition cost and freight volatility
- Site preparation and installation complexity
- Systems integration and compliance validation
- Operational upkeep, spare parts, and support
- Replacement cycle, disruption risk, and disposal cost
When these buckets are visible, low-price options often stop looking low-cost.
How do you judge whether the ROI benchmarks are realistic?
ROI claims are often inflated because they combine best-case revenue uplift with incomplete operating cost assumptions.
A stronger commercial optimization guide separates hard savings from soft gains. Hard savings are measurable within finance and operations. Soft gains still matter, but they need different treatment.
Hard savings usually include energy reduction, labor time saved, shrinkage reduction, fewer service calls, or better freight efficiency.
Soft gains usually involve brand consistency, shopper comfort, improved conversion quality, or stronger sustainability positioning.
In actual deployments, payback windows vary by category. The table below gives a more grounded reference range.
These ranges are not guarantees. They are a useful planning frame for a commercial optimization guide when category assumptions are tested honestly.
More often than not, realistic ROI comes from fewer operational leaks, not dramatic sales spikes.
Which risks create the biggest regret after rollout?
The most expensive mistakes are usually not visible during vendor presentations. They appear after scale.
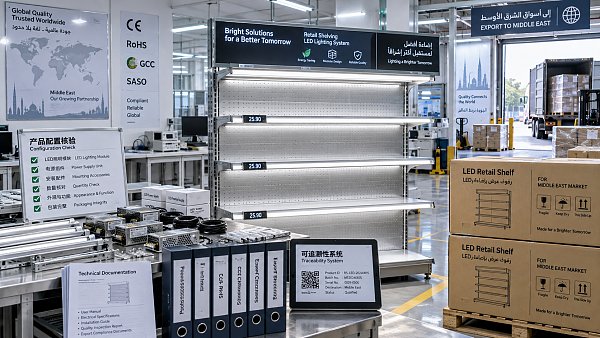
One major risk is technical mismatch. A component may pass in one market, then fail documentation or electrical requirements in another.
Another is performance inconsistency. A prototype can look excellent, while batch production introduces finish variation, fit issues, or unstable electronics.
Supply chain concentration is another concern. If one source controls tooling, firmware, and spare parts, future leverage becomes weak.
There is also design risk. Over-optimized cost can damage the customer environment, especially in premium retail, hospitality, and mixed-use spaces.
In that sense, a commercial optimization guide should not treat aesthetics as decoration. Lighting tone, fixture ergonomics, signage legibility, and packaging touchpoints influence conversion and trust.
A practical risk review should include these checkpoints:
- Certification alignment across target markets
- Pilot-to-production consistency controls
- Data security and software support duration
- Spare parts availability and service response
- Material durability under actual usage conditions
- Environmental claims backed by measurable evidence
This is where benchmark platforms such as G-BCE become relevant. They help compare commercial hardware and supply inputs against standards instead of visual impressions alone.
How should different solutions be compared when every vendor looks credible?
The easiest mistake is comparing proposals by unit price and lead time only. That works for commodities, not for commercial optimization.
A better commercial optimization guide uses a weighted comparison model. It forces the decision to reflect real business priorities.
For example, a global rollout may give higher weight to certification, repeatability, and after-sales support. A flagship concept may give more weight to finish quality and brand alignment.
In practical terms, most evaluations become clearer when the scoring logic is visible before quotations are reviewed.
This comparison method is especially useful when sourcing spans Asian production bases and international commercial environments with different quality expectations.
What is a sensible first step if the project scope still feels broad?
Start smaller than the ambition, but not smaller than the decision logic.
A strong commercial optimization guide does not begin with a shopping list. It begins with a baseline.
That baseline should capture current operating cost, failure points, service burden, visual inconsistencies, and compliance exposure across the commercial environment.
Then narrow the first phase to the areas with the clearest combined effect on cost and experience.
In many cases, that means choosing one of these starting points:
- Lighting and controls where energy waste is measurable
- POS and retail systems where transaction friction is visible
- Fixtures where replacement cycles are too short
- Packaging where freight and damage costs are rising
From there, build a scorecard with cost assumptions, technical standards, pilot metrics, and acceptable payback thresholds.
The reason this works is simple. It turns modernization from a broad intention into a measurable sequence.
A commercial optimization guide is most effective when it helps separate urgent upgrades from attractive but low-impact ideas.
If the next step is unclear, review current assets against benchmark criteria used in platforms like G-BCE, then test one category with the highest cost leakage and the lowest implementation ambiguity.
That approach usually leads to better sourcing discipline, cleaner ROI tracking, and fewer surprises during rollout.
News Recommendations
 What records are needed for an ISO 9001 furniture factory audit?
![51a6ab95581761cc26f4318be6520c15]()
Aris Katos
Future of Carbide Coatings
 How to choose AI marketing tools that work with your existing CRM
![51a6ab95581761cc26f4318be6520c15]()
Aris Katos
Future of Carbide Coatings
 Do freight costs erase savings when buying retail fixtures wholesale?
![51a6ab95581761cc26f4318be6520c15]()
Aris Katos
Future of Carbide Coatings
 Can smart retail IT solutions for CPG work with legacy POS systems?
![51a6ab95581761cc26f4318be6520c15]()
Aris Katos
Future of Carbide Coatings
 What permit approvals belong in a commercial fitout planning checklist?
![51a6ab95581761cc26f4318be6520c15]()
Aris Katos
Future of Carbide Coatings
 How Does Commercial Design Differ from Interior Decoration?
![51a6ab95581761cc26f4318be6520c15]()
Aris Katos
Future of Carbide Coatings
 How Long Does It Take to Verify a Commercial Furniture Supplier?
![51a6ab95581761cc26f4318be6520c15]()
Aris Katos
Future of Carbide Coatings
 How to verify compostability claims from a bubble mailer manufacturer
![51a6ab95581761cc26f4318be6520c15]()
Aris Katos
Future of Carbide Coatings
 Will commercial smart infrastructure solutions work with legacy systems?
![51a6ab95581761cc26f4318be6520c15]()
Aris Katos
Future of Carbide Coatings
 How to verify a preschool furniture manufacturer's safety standards
![51a6ab95581761cc26f4318be6520c15]()
Aris Katos
Future of Carbide Coatings
 A technical comparison of semiconductor processes for power devices
![51a6ab95581761cc26f4318be6520c15]()
Aris Katos
Future of Carbide Coatings
 How to verify that a BIFMA ergonomic chair meets the standard
![51a6ab95581761cc26f4318be6520c15]()
Aris Katos
Future of Carbide Coatings
 How to use a CRI value chart when choosing LED lighting
![51a6ab95581761cc26f4318be6520c15]()
Aris Katos
Future of Carbide Coatings
 How to compare hotel aroma diffuser wholesale options by coverage area
![51a6ab95581761cc26f4318be6520c15]()
Aris Katos
Future of Carbide Coatings
 How to prevent O-rings and seals from failing in food equipment
![51a6ab95581761cc26f4318be6520c15]()
Aris Katos
Future of Carbide Coatings
 How to compare commercial linear light wholesale quotes accurately
![51a6ab95581761cc26f4318be6520c15]()
Aris Katos
Future of Carbide Coatings
 How to verify international standards compliance for Middle East exports
![51a6ab95581761cc26f4318be6520c15]()
Aris Katos
Future of Carbide Coatings
 How to select laboratory instruments for reproducible test results
![51a6ab95581761cc26f4318be6520c15]()
Aris Katos
Future of Carbide Coatings
 When does a sheet metal prototype reveal design flaws early?
![51a6ab95581761cc26f4318be6520c15]()
Aris Katos
Future of Carbide Coatings
 When PE air column bags reduce damage in e-commerce fulfillment
![51a6ab95581761cc26f4318be6520c15]()
Aris Katos
Future of Carbide Coatings
 How energy-efficient design reduces operating costs in retail lighting
![51a6ab95581761cc26f4318be6520c15]()
Aris Katos
Future of Carbide Coatings
 When commercial aluminum storefronts make sense for a retail renovation
![51a6ab95581761cc26f4318be6520c15]()
Aris Katos
Future of Carbide Coatings
 What makes LED lights durable in high-use commercial spaces?
![51a6ab95581761cc26f4318be6520c15]()
Aris Katos
Future of Carbide Coatings
 Which industry categories offer the strongest export potential in Latin America?
![51a6ab95581761cc26f4318be6520c15]()
Aris Katos
Future of Carbide Coatings
 How to choose an ultra bright waterproof window display for storefronts
![51a6ab95581761cc26f4318be6520c15]()
Aris Katos
Future of Carbide Coatings
 How to verify suppliers on a trade portal for global sourcing
![51a6ab95581761cc26f4318be6520c15]()
Aris Katos
Future of Carbide Coatings
 How RoHS requirements should be stated in product specifications
![51a6ab95581761cc26f4318be6520c15]()
Aris Katos
Future of Carbide Coatings
 What affects the lead time for custom retail counter displays?
![51a6ab95581761cc26f4318be6520c15]()
Aris Katos
Future of Carbide Coatings
 What consumer packaging USA importers need to verify before ordering
![51a6ab95581761cc26f4318be6520c15]()
Aris Katos
Future of Carbide Coatings
 How commercial spaces interiors shape customer dwell time
![51a6ab95581761cc26f4318be6520c15]()
Aris Katos
Future of Carbide Coatings
 How LED commercial lighting design reduces glare in retail spaces
![51a6ab95581761cc26f4318be6520c15]()
Aris Katos
Future of Carbide Coatings
 How industrial technology information improves RFID inventory accuracy
![51a6ab95581761cc26f4318be6520c15]()
Aris Katos
Future of Carbide Coatings
 When drip garden watering systems make more sense than sprinklers
![51a6ab95581761cc26f4318be6520c15]()
Aris Katos
Future of Carbide Coatings
 When category comparison improves sourcing for industrial applications
![51a6ab95581761cc26f4318be6520c15]()
Aris Katos
Future of Carbide Coatings
 Industrial application guidance for selecting the right LED lighting
![51a6ab95581761cc26f4318be6520c15]()
Aris Katos
Future of Carbide Coatings
 Which commercial architecture standards apply to European retail fit-outs?
![51a6ab95581761cc26f4318be6520c15]()
Aris Katos
Future of Carbide Coatings
 How to verify FDA requirements for maternity care products
![51a6ab95581761cc26f4318be6520c15]()
Aris Katos
Future of Carbide Coatings
 How to verify BPA-free claims for food-contact products
![51a6ab95581761cc26f4318be6520c15]()
Aris Katos
Future of Carbide Coatings
 When does a European wholesale supplier suit modular office projects?
![51a6ab95581761cc26f4318be6520c15]()
Aris Katos
Future of Carbide Coatings