How can satellite crop data help estimate crop yields?
Time
Click Count
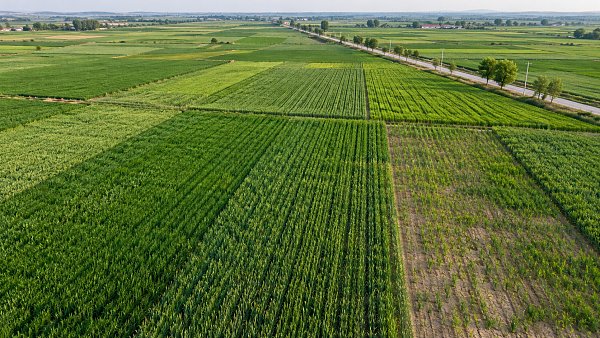
Satellite observations can help estimate crop yields by showing how crops develop across an area and how that development compares with conditions associated with past harvests. They do not measure harvested grain directly. A useful forecast combines observations of vegetation and growing conditions with crop-specific information, historical yields, weather records, and, where available, field measurements.
The distinction matters because a green, healthy-looking field does not always produce a high yield. Planting density, water stress, heat during flowering, disease, and harvest losses can all affect the amount ultimately collected. Satellite crop data is most valuable when it is interpreted as part of that wider growing picture rather than treated as a harvest measurement on its own.
What satellites can reveal about a growing crop
Satellites carry sensors that detect energy reflected or emitted from the Earth’s surface. Different sensors provide different kinds of evidence: optical imagery captures visible and near-infrared light, thermal observations can indicate surface temperature, and microwave sensors can provide information even when clouds obstruct optical images.
For yield estimation, the most familiar measurements describe the crop canopy. Healthy vegetation absorbs much of the red light used in photosynthesis and reflects a relatively large amount of near-infrared light. Vegetation indices combine these measurements to summarize aspects of plant cover and condition. The normalized difference vegetation index, or NDVI, is one common example.
A time series of vegetation measurements can show when a crop emerges, how quickly its canopy develops, when it reaches peak growth, and when it begins to mature. If a region’s crop cover develops more slowly than it did in comparable seasons, that pattern may signal delayed planting or unfavorable growing conditions. A decline during the growing season can indicate stress, although the imagery alone may not identify its cause.
Other observations add context. Land surface temperature can help reveal unusually hot conditions, while some satellite products provide estimates of surface soil moisture or rainfall. These are not interchangeable with measurements at plant roots or at a farm weather station: each product represents conditions at a particular spatial scale and carries its own uncertainty.
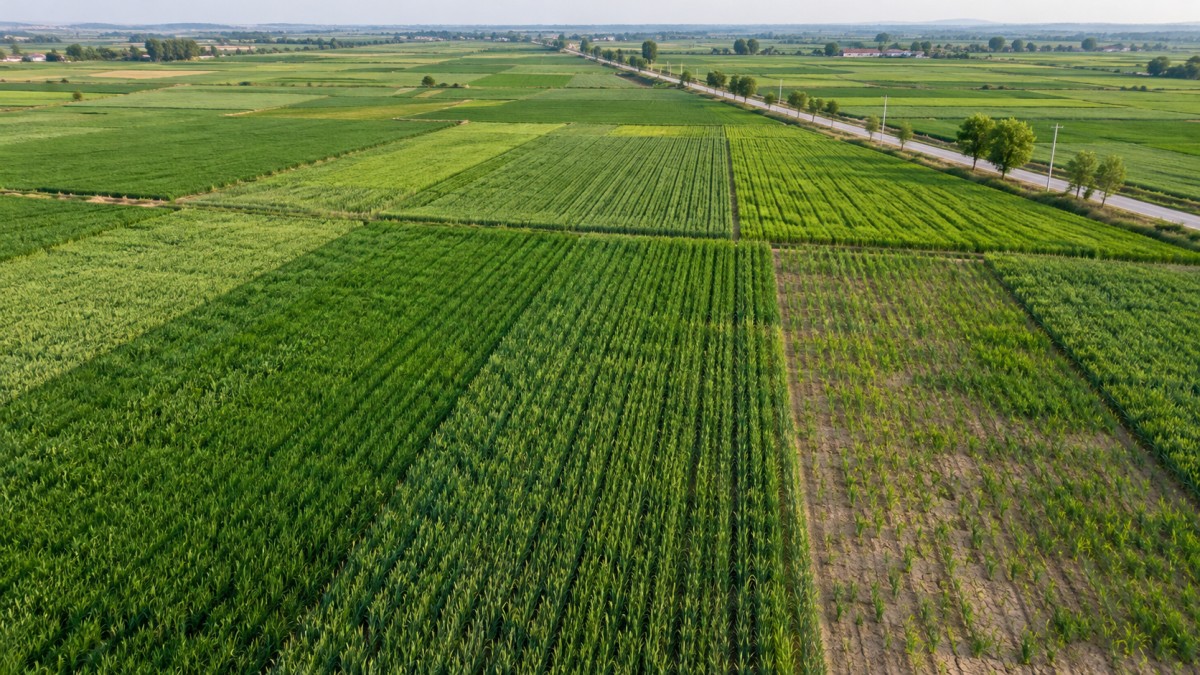
Satellite observations are also used to map crop extent and, where classification is reliable, distinguish crop types. This is important because production depends on both yield per unit area and the area harvested. A good yield estimate applied to the wrong crop area can still produce a misleading estimate of total output.
How observations become a yield estimate
The calculation starts with a clear target: the crop, geographic area, harvest season, and unit of measurement. A forecast for wheat yield per hectare in one district is a different task from estimating national wheat production. The former focuses on productivity; the latter also requires an estimate of harvested area.
Analysts then assemble observations over the growing season rather than relying on a single image. A simplified workflow might look like this:
- Identify the crop area. Use field boundaries, crop maps, land-cover classifications, or other records to isolate the area of interest.
- Build a seasonal record. Extract vegetation, temperature, moisture, and other relevant observations at intervals that capture crop development.
- Add local context. Combine the satellite record with weather, planting dates, irrigation information, soil characteristics, or field observations when those data are available.
- Relate conditions to yield. Use historical yield records and a statistical, machine-learning, or crop growth model to estimate the relationship between observed conditions and harvest outcomes.
- Update and validate. Revise the forecast as new observations arrive, then compare it with independent harvest data when those data become available.
The relationship between a satellite signal and yield is rarely a simple conversion. An index value does not translate into a fixed number of tonnes per hectare across all crops and locations. A dense canopy may indicate strong growth, but yield also depends on how effectively the plant converts growth into the harvested product.
Timing is therefore as important as the index itself. For a cereal crop, water stress during flowering or grain filling can be more consequential than a similar stress event at a less sensitive stage. A model that aligns observations with crop development has a better basis for interpreting an apparent anomaly than one that compares the same calendar dates without considering planting differences.
Different modeling approaches answer different questions
A historical comparison is the most intuitive starting point. Analysts compare the current season’s vegetation development and weather with previous seasons, then examine the yields associated with similar patterns. This approach is straightforward to interpret, but it depends on having enough comparable seasons. Changes in crop varieties, irrigation, management, or reporting methods can weaken the relationship between past conditions and current yield.
Statistical and machine-learning models can combine more variables and capture relationships that are not obvious from a single indicator. For example, a model might use vegetation measurements at several growth stages alongside temperature and rainfall. Its usefulness still depends on the quality of its training data. A model trained on one region’s crop practices may not transfer reliably to another without local evaluation or adjustment.
Crop growth models take a different route. They simulate processes such as crop development, water use, and biomass accumulation using information about weather, soil, crop characteristics, and management. Satellite observations can help adjust parts of the simulation, such as the estimated state of the crop canopy. This approach can provide insight into why a forecast changes, but it requires inputs that may be incomplete or uncertain over large areas.
Hybrid approaches combine these methods. The choice is less about finding one universally superior model than about matching the method to available records, the scale of the forecast, and the need to explain the result.
Why a satellite-based forecast can be wrong
Clouds and observation gaps. Optical sensors cannot see the land surface clearly through cloud cover. If persistent clouds obscure a critical growth stage, the model may miss an important stress event. Combining observations from multiple dates or sensors can reduce gaps, but it does not recreate every missed condition perfectly.
Pixel size and mixed land cover. Each satellite pixel represents an area on the ground. Where fields are small, a pixel may include several crops, bare soil, trees, or roads. The resulting signal is a mixture rather than a clean measurement of one field. Matching imagery resolution to field size and using reliable crop masks are important safeguards.
Vegetation indices have limits. NDVI can become less sensitive to additional growth in dense canopies. It can also be influenced by exposed soil early in the season. A high index value indicates substantial green vegetation, not necessarily a high grain, fruit, or tuber yield. Other measurements and crop-specific models can help, but none eliminates the need for validation.
Crop stress can be difficult to diagnose. Heat, drought, nutrient deficiencies, pests, and disease may produce similar changes in canopy appearance. Some yield losses occur before a clear visual signal appears; others, such as damage near harvest, can occur after an earlier forecast has been issued. Satellite indicators show that conditions have changed more readily than they establish a single cause.
Yield records are not always comparable. Training and validation data may differ in geographic coverage, crop definition, harvest moisture basis, or reporting method. Field-scale yield monitor readings, survey estimates, and official regional statistics do not necessarily describe the same quantity with the same precision. A model can appear inaccurate because its reference data are inconsistent—or appear accurate because the evaluation does not adequately separate training data from test data.
Reading an estimate in context
A yield forecast should be interpreted alongside its date. An early-season estimate may rely heavily on historical averages and emerging crop conditions. As the season progresses, observations can capture more of the crop’s actual development, but the forecast remains exposed to events that have not yet happened. A forecast issued before flowering, for example, cannot directly observe the effect of later heat stress during that stage.
Geographic scale also changes what an estimate can support. Regional averages can conceal severe losses in individual fields while smoothing out some local variation. Field-level estimates offer more detail, but they demand accurate boundaries, suitable image resolution, and representative ground data. A model that performs adequately across a large production region should not automatically be assumed reliable for a single farm.
The most informative result includes more than one number. A forecast is easier to assess when it identifies the crop and area covered, the observation period, the data sources, the yield definition, and the method used for validation. An uncertainty range is especially useful when it reflects tested forecast errors rather than simply presenting a narrow interval around a model output.
Historical performance should be checked at the same scale and forecast stage as the intended use. An end-of-season model may look accurate because it has observed nearly the entire growing cycle; that does not establish how well it would have forecast yield months earlier. Likewise, testing only on fields or seasons used to develop the model can overstate its ability to handle new conditions. Independent seasons or locations provide a stronger check, although unusual events can still challenge the model.
Using yield estimates without confusing them with production
Yield describes output per unit of harvested area. Total production is the combination of yield and harvested area, so both estimates matter. A region can have a strong yield per hectare but lower total output if less land is harvested. Conversely, a larger harvested area can partly offset a reduction in yield.
This distinction becomes important when forecasts inform food supply analysis. A satellite-derived picture of healthy crops may support an improved yield outlook, but it does not by itself establish how much crop will enter the market. Final harvested area, storage losses, domestic consumption, and trade conditions sit outside a canopy observation.
Satellite data is most useful as a timely, repeatable source of evidence across large areas, particularly when ground reports are delayed or uneven. Its strongest contribution is not a definitive harvest figure at every point in the season, but a forecast that can be updated, compared with independent information, and interpreted with a clear understanding of what the sensors can—and cannot—observe.
News Recommendations
 EU Ban on Plastic Waste Exports to Non-OECD Countries Takes Effect
![51a6ab95581761cc26f4318be6520c15]()
Aris Katos
Future of Carbide Coatings
 How to choose dining furniture for a small restaurant
![51a6ab95581761cc26f4318be6520c15]()
Aris Katos
Future of Carbide Coatings
 EU Bans Plastic Waste Exports to Non-OECD Countries
![51a6ab95581761cc26f4318be6520c15]()
Aris Katos
Future of Carbide Coatings
 How to verify an NSF certification claim for food packaging
![51a6ab95581761cc26f4318be6520c15]()
Aris Katos
Future of Carbide Coatings
 Germany Flags Chinese LED Lighting Product in RAPEX Alert
![51a6ab95581761cc26f4318be6520c15]()
Aris Katos
Future of Carbide Coatings
 How can satellite crop data help estimate crop yields?
![51a6ab95581761cc26f4318be6520c15]()
Aris Katos
Future of Carbide Coatings
 EU Food-Contact Recycled Plastics Regulation Takes Effect on November 18
![51a6ab95581761cc26f4318be6520c15]()
Aris Katos
Future of Carbide Coatings
 How to match a constant current dimmable LED driver to your LEDs
![51a6ab95581761cc26f4318be6520c15]()
Aris Katos
Future of Carbide Coatings
 EU PPWR Takes Effect as Flexible Packaging Faces PFAS and Recyclability Rules
![51a6ab95581761cc26f4318be6520c15]()
Aris Katos
Future of Carbide Coatings
 How to choose commercial lighting for restaurant dining rooms
![51a6ab95581761cc26f4318be6520c15]()
Aris Katos
Future of Carbide Coatings
 Invidis Explores Shenzhen's Digital Signage Supply Chain During APEC 2026
![51a6ab95581761cc26f4318be6520c15]()
Aris Katos
Future of Carbide Coatings
 How to verify a building facade lighting manufacturer's warranty
![51a6ab95581761cc26f4318be6520c15]()
Aris Katos
Future of Carbide Coatings
 IndexBox: Healthy Lighting and Smart Homes Drive Warm-White Night-Light Growth
![51a6ab95581761cc26f4318be6520c15]()
Aris Katos
Future of Carbide Coatings
 How to assess laminate finish durability for hotel furniture
![51a6ab95581761cc26f4318be6520c15]()
Aris Katos
Future of Carbide Coatings
 Which consumer goods need CE marking in Europe?
![51a6ab95581761cc26f4318be6520c15]()
Aris Katos
Future of Carbide Coatings
 Uniguest and Extreme Networks Partner to Simplify Digital Signage Deployment
![51a6ab95581761cc26f4318be6520c15]()
Aris Katos
Future of Carbide Coatings
 How to assess electronics compliance whitepapers for regulatory accuracy
![51a6ab95581761cc26f4318be6520c15]()
Aris Katos
Future of Carbide Coatings
 Packaging Data Hub Launches With Plastic Recycling Findings for 50 Countries
![51a6ab95581761cc26f4318be6520c15]()
Aris Katos
Future of Carbide Coatings
 How to verify an ergonomic office chair supplier's warranty terms
![51a6ab95581761cc26f4318be6520c15]()
Aris Katos
Future of Carbide Coatings
 Curion Survey: 64% Value Sustainable Beauty Packaging, but Quality Comes First
![51a6ab95581761cc26f4318be6520c15]()
Aris Katos
Future of Carbide Coatings
 Can minimalist fit out solutions make a small office feel larger?
![51a6ab95581761cc26f4318be6520c15]()
Aris Katos
Future of Carbide Coatings
 Kiosk Industry Releases IAAPA 2026 Self-Service Guide
![51a6ab95581761cc26f4318be6520c15]()
Aris Katos
Future of Carbide Coatings
 How to improve global supply chain visibility beyond tier-one suppliers
![51a6ab95581761cc26f4318be6520c15]()
Aris Katos
Future of Carbide Coatings
 Austria’s MM Group to Sell 70% of Packaging Business to KPS for $2.7 Billion
![51a6ab95581761cc26f4318be6520c15]()
Aris Katos
Future of Carbide Coatings
 How to assess delivery reliability of airport terminal seating suppliers in Europe
![51a6ab95581761cc26f4318be6520c15]()
Aris Katos
Future of Carbide Coatings
 USTR Extends China-Linked Vessel Fee Pause and 178 Product Exemptions to January 2027
![51a6ab95581761cc26f4318be6520c15]()
Aris Katos
Future of Carbide Coatings
 How to choose smart sensors for automated lighting
![51a6ab95581761cc26f4318be6520c15]()
Aris Katos
Future of Carbide Coatings
 Shanghai Retail Buyers Sign Deals at Ninth China International Import Expo
![51a6ab95581761cc26f4318be6520c15]()
Aris Katos
Future of Carbide Coatings
 Which toys are subject to EN 71 toy safety requirements?
![51a6ab95581761cc26f4318be6520c15]()
Aris Katos
Future of Carbide Coatings
 Report: Global Kraft Paper Market Forecast to Reach $20.5 Billion by 2033
![51a6ab95581761cc26f4318be6520c15]()
Aris Katos
Future of Carbide Coatings
 How to verify Zigbee compatibility when sourcing lighting sensors
![51a6ab95581761cc26f4318be6520c15]()
Aris Katos
Future of Carbide Coatings
 How do packaging customization options affect minimum order quantities in Europe?
![51a6ab95581761cc26f4318be6520c15]()
Aris Katos
Future of Carbide Coatings
 Transom to Acquire Cree LED in Commercial Lighting Ownership Change
![51a6ab95581761cc26f4318be6520c15]()
Aris Katos
Future of Carbide Coatings
 How to plan customer flow in commercial design planning
![51a6ab95581761cc26f4318be6520c15]()
Aris Katos
Future of Carbide Coatings
 USTR Urged to Permanently Suspend Fees on China-Linked Ships
![51a6ab95581761cc26f4318be6520c15]()
Aris Katos
Future of Carbide Coatings
 How to choose comparable stores for retail benchmarking
![51a6ab95581761cc26f4318be6520c15]()
Aris Katos
Future of Carbide Coatings
 How does anchoring affect modular building wind load resistance?
![51a6ab95581761cc26f4318be6520c15]()
Aris Katos
Future of Carbide Coatings
 Amazon Raises European FBA Surcharge to 2% in Ten Markets From November 2
![51a6ab95581761cc26f4318be6520c15]()
Aris Katos
Future of Carbide Coatings
 How to verify a BPA-free test report for baby products
![51a6ab95581761cc26f4318be6520c15]()
Aris Katos
Future of Carbide Coatings